Dashboards
Dashboards
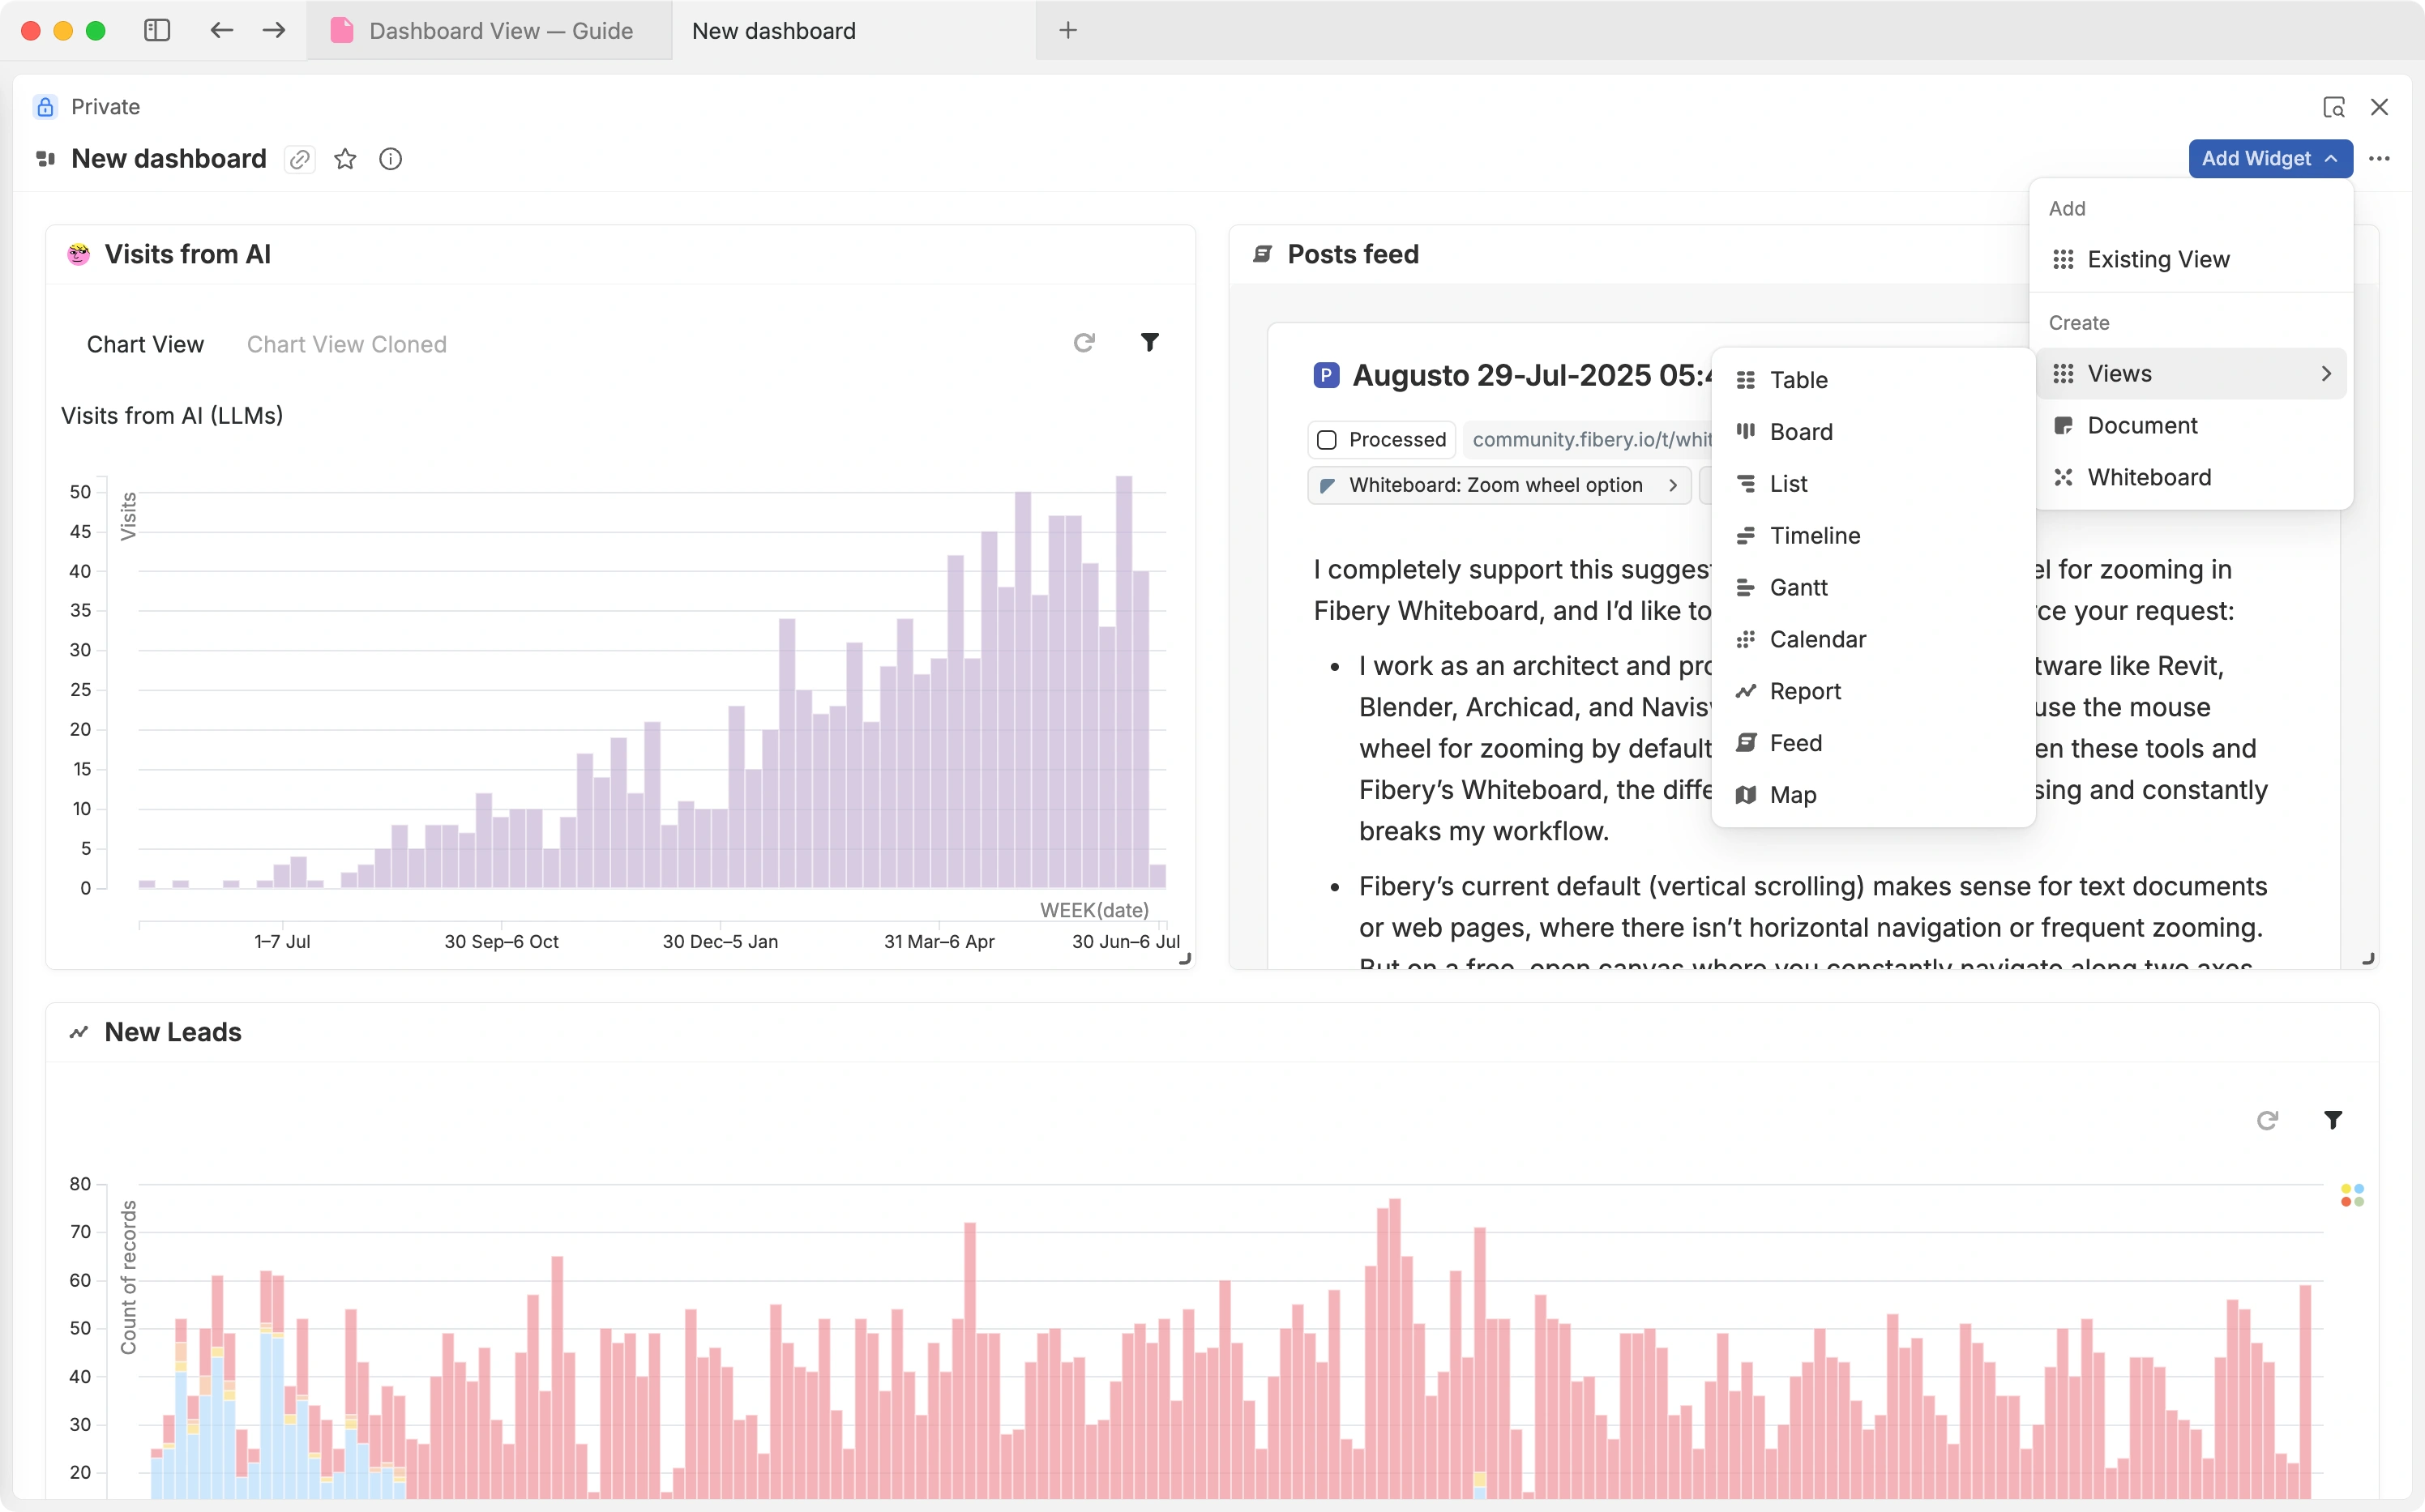
Visualize information in a dense way via flexible layouts. Insert charts, track metrics & monitor trends. Combine relevant views together & explore a lot of information in a single place.
Why it's important? ☝️ Dashboards helps to organize and visualize information in a dense and flexible way. Insert charts or other views, re-size them and create beautiful layouts to help people comprehend information faster.
Create Dashboards on top level or inside entities like Projects and Teams. Use existing Views or create new Views right inside Dashboard.
Some more of our best features
Some more of our best features
Try for free till you ♥ it, or till trial expires :)A 14-day trial is on us. No credit card required.
Try for free till you ♥ it, or till trial expires :)
A 14-day trial is on us. No credit card required.
All this content is for you, not for SEO (doesn't work anyway)
All this content is for you, not for SEO (doesn't work anyway)